Bitcoin Technical Analysis Report – Nov 20, 2025
Comprehensive Bitcoin technical analysis for November 20, 2025, covering price trends, key levels, market indicators, sentiment and trading outlook.

Bitcoin enters the trading week of November 20, 2025 with heightened uncertainty after a sharp correction from its historic high reached in early October. The cryptocurrency market has shifted from a period of enthusiasm and relentless upward momentum to one characterized by caution, risk aversion and increased volatility. This transition has left traders and long-term investors seeking clarity as Bitcoin searches for a stable support zone capable of anchoring its next decisive move.
As of the morning of November 20, Bitcoin is fluctuating within the mid-$80,000 price region. This range reflects a significant retracement from its all-time high near $126,000 set just weeks earlier. The market has experienced dramatic intraday swings, with liquidity thinning during periods of intense selling pressure. These movements have introduced a new wave of complexity into Bitcoin technical analysis, prompting market watchers to examine price structure, moving averages, oscillator behavior and sentiment direction with greater scrutiny.
The following sections present a detailed and comprehensive technical breakdown of Bitcoin as of November 20, 2025. This report blends real-time market structure with broader context, offering insight into the most important support and resistance zones, the relevance of major indicators, the influence of broader sentiment trends and the potential scenarios shaping Bitcoin’s short-term and medium-term trajectory. While no form of analysis can eliminate uncertainty, a disciplined approach provides the framework needed to interpret market conditions with clarity and confidence.
Introduction to the Current Market Landscape
Bitcoin’s surge to $126,000 earlier in the year reflected an extraordinary period fueled by institutional inflows, aggressive derivatives positioning and renewed optimism surrounding long-term digital asset adoption. The breakout through previous all-time highs accelerated a momentum-driven rally that, unsurprisingly, invited both speculation and leverage into the market. When risk appetite is elevated and profit-taking pressure accumulates, markets often transition from trend acceleration to a corrective phase, and Bitcoin has followed that pattern with remarkable precision.
The month of November opened with a noticeable shift in trader behavior. Bitcoin began to show signs of exhaustion near the $110,000–$115,000 region, where several attempts to reclaim upward momentum were met with selling pressure. That region acted as a warning signal that the market was preparing for a period of rebalancing rather than continuation. As macroeconomic indicators began to shift and expectations surrounding interest rate cuts softened, risk-on assets faced renewed headwinds. Bitcoin, often treated as a high-volatility macro-sensitive asset, reacted decisively as short-term technical levels broke down.
By November 20, the broader narrative has become one of recalibration. The excitement of October’s peak has given way to the analytical discipline of November’s measured pullback. Traders are now closely evaluating the behavior of Bitcoin around its current levels to determine whether the market is forming a temporary base or preparing for deeper corrective movement.
Price Action and Technical Structure

Bitcoin’s price action during the second half of November has been defined by its repeated failures to reclaim previously established support levels that have now transformed into resistance. The upper wicks seen on several recent daily candles illustrate the persistent selling pressure that emerges every time the price attempts to push higher. These rejections have effectively sculpted a downward-leaning structure on the chart, with lower highs appearing consistently across daily and intraday timeframes.
The mid-$80,000 zone has emerged as a focal point for traders. The price has tested this region multiple times and continues to hover near it, indicating that buyers are still active but not strong enough to reverse momentum. These conditions often signal a market searching for equilibrium. If Bitcoin can maintain stability in this range and form a higher low on the four-hour or daily chart, it could set the foundation for a short-term rebound. However, if the price closes decisively below recently tested support levels, bearish continuation becomes the more probable outcome.
The structure on the weekly chart helps contextualize the overall position of the market. Even with the recent downturn, Bitcoin remains significantly higher than it was earlier in the year. This reinforces the idea that the current environment may be part of a mid-cycle corrective pattern rather than the beginning of a prolonged bear market. The challenge for traders lies in distinguishing short-term weakness from the broader long-term trend, which still favors structural growth.
Analysis of Moving Averages and Trend Indicators
Moving averages offer essential insight into the strength and direction of the trend. On November 20, Bitcoin is trading below both its 50-day and 200-day moving averages. This crossover into bearish territory has traditionally signaled caution, especially for trend-following traders who adjust exposure when price falls beneath these key markers.
The 10-day and 20-day moving averages have firmly tilted downward, reflecting short-term momentum that has shifted toward selling. The 50-day average, which is often watched closely for medium-term trend signals, is beginning to slope downward as well. Although the 200-day moving average still points upward, indicating long-term structural support, the widening gap between spot price and the 200-day level underscores the magnitude of the recent correction.
Even though these indicators lean bearish, they also present potential opportunity zones. Historically, Bitcoin has delivered significant rebounds after extended deviations below the 200-day moving average. The current distance between spot price and long-term averages suggests that a period of mean reversion may occur once selling pressure subsides. Traders will be paying close attention to how the moving averages react if Bitcoin attempts to reclaim higher levels in the coming days and weeks.
Momentum Oscillators and Market Strength
Momentum oscillators provide an important complement to trend-based indicators. On November 20, the Relative Strength Index on the daily chart is positioned in the low-40s, indicating that selling momentum remains prevalent but has not yet reached deeply oversold territory. When RSI hovers in this region, it often reflects a continuation of the existing trend unless rapid buying intervenes.
The Moving Average Convergence Divergence indicator paints a similarly cautious picture. The MACD line has crossed below its signal line, and the histogram continues to print negative bars. These signals point to sustained bearish momentum and increased risk of further downside pressure. For traders waiting for a momentum reversal, an early sign of a shift would be a flattening MACD histogram followed by a move toward the zero line.
Stochastic oscillators offer more responsiveness and currently indicate a market that is attempting to stabilize but struggling to reclaim strength. The fast and slow stochastic lines have recently rolled over near overbought conditions on shorter time frames, confirming that upward moves are being sold into rather than creating sustained momentum. Until these oscillators begin showing positive divergence, traders are likely to remain cautious.
Volatility Outlook and Bollinger Band Dynamics
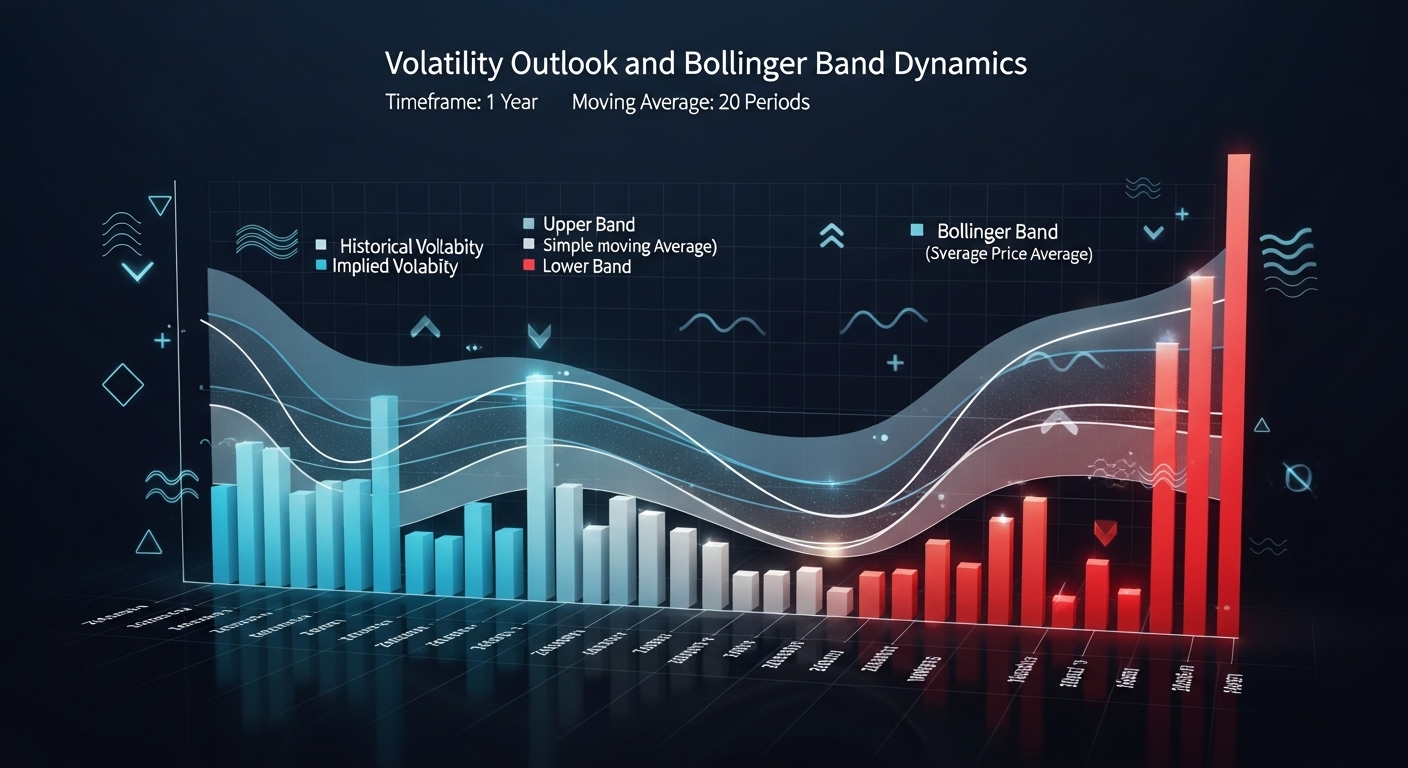
Bitcoin’s Bollinger Bands have widened considerably throughout November as volatility returned to the market. When the bands expand after a period of narrowing, it indicates that price is entering a more dynamic and potentially unstable phase. Bitcoin’s repeated touches near the lower band suggest persistent downside pressure, although they also reveal that price may be stretching beyond normal ranges.
A key detail to watch is whether Bitcoin closes multiple candles below the lower band or begins to stabilize within the bands again. Persistent closes below the lower band can signal the early stages of a more aggressive downtrend. Conversely, if price begins closing above the midpoint of the bands, it may suggest that a reversal or at least a consolidation period is underway.
Volatility is both a risk and an opportunity in markets like Bitcoin. Elevated volatility tends to shake out weaker positions, often setting the stage for more defined movements afterward. Traders will be monitoring the bands closely to determine when volatility begins to compress again, as that often precedes significant directional shifts.
Key Support and Resistance Zones
The most immediate support zone sits near the $85,000 level. This area has acted as a critical foundation throughout mid-November, with multiple intraday bounces occurring as buyers defend the level from further breakdown. If the price loses this support with a convincing daily close, the door opens to the low-$80,000 range and potentially to deeper historical levels that could attract long-term buyers.
On the upside, the first meaningful resistance zone lies between $90,000 and $95,000. This region now contains previously broken support levels, short-term moving averages and multiple intraday rejection points. It has transitioned from an area of demand to one of supply, and Bitcoin will need substantial buying volume to reclaim it. Above this range sits the highly psychological $100,000 threshold, which also aligns with major moving averages and earlier consolidation patterns.
A sustained move back above $100,000 would dramatically improve the short-term technical outlook, but achieving that requires a shift not only in price structure but also in sentiment and derivatives positioning. Until these changes occur, resistance zones above current price levels will continue to represent formidable barriers.
Market Sentiment and Macroeconomic Context
Market sentiment during the second half of November has shifted from optimism to caution. Fear-driven sentiment indicators show declining confidence as traders adjust their outlook in response to Bitcoin’s rapid correction. This psychological shift often accompanies multi-week pullbacks and can influence the speed of market reactions to new price levels.
Macroeconomic conditions play a crucial role in shaping Bitcoin’s short-term trajectory. Investors had hoped for more aggressive interest rate cuts by major central banks during the final quarter of the year. When those expectations weakened, risk assets faced renewed selling pressure. Bitcoin, which has shown growing correlation with macro risk cycles, responded by moving lower in tandem with equities and other speculative markets.
Despite this, the long-term adoption narrative remains intact. Bitcoin continues to attract attention from institutional investors, corporate treasuries and global retail participants. This broader environment suggests that any deep corrective move could ultimately become an accumulation opportunity for those focused on multi-year horizons.
See More: Bitcoin dives to six month low amid US economic uncertainty again
Short-Term Trading Scenarios
The bullish scenario for Bitcoin heading into late November revolves around the ability of price to stabilize above the mid-$80,000 support zone. If Bitcoin forms a higher low on the four-hour or daily chart and begins to show improving momentum through rising RSI values and flattening MACD momentum, a rebound toward the $90,000–$95,000 region becomes plausible. A reclaim of this area could shift the narrative toward recovery, particularly if long-term buyers use the correction to add to positions.
The bearish scenario unfolds if Bitcoin breaks decisively below the $85,000 support level and attracts further selling pressure. A close beneath this threshold would likely trigger stop-loss cascades and forced liquidations from leveraged positions. Such a development could drive Bitcoin toward the low-$80,000 region and potentially toward the upper-$70,000 threshold where previous high-volume nodes are located. This scenario, while uncomfortable for short-term traders, could create more favorable entry conditions for longer-term investors.
Medium- and Long-Term Technical Outlook
In the broader view, Bitcoin remains structurally strong despite the recent correction. The long-term charts continue to show higher highs and higher lows stretching back several years. Bitcoin’s ability to remain significantly above earlier cycle lows indicates that the current decline may represent a resetting of market conditions rather than the start of a long-term reversal.
The next phase of Bitcoin’s trend will likely depend on its ability to establish a strong base during the current correction. If the market builds stability within the mid-$80,000 range or slightly below, it may provide the structural foundation for a new leg upward in 2026. The combination of ongoing institutional involvement, expanding ETF participation, and maturing derivatives markets strengthens the argument for long-term resilience.
Conclusion
The Bitcoin Technical Analysis Report for November 20, 2025 highlights a market undergoing recalibration. Bitcoin has retreated sharply from its all-time high, trading below important moving averages and testing critical support zones. Momentum indicators show sustained bearish pressure, while volatility remains elevated. Yet beneath this cautionary surface lies a long-term structure that continues to favor growth.
Bitcoin’s path forward depends on how it behaves around the support levels currently in play. A stable base could signal the beginning of a new accumulation phase, while a breakdown may extend the correction and create conditions for deeper value-oriented entry points. Traders and investors navigating this environment must combine technical insight, disciplined strategy and awareness of broader sentiment trends to make informed decisions.