Bitcoin Market Structure Analysis – Navigating Conflicting Signals Across Multiple Timeframes
Bitcoin market structure analysis explaining conflicting signals across timeframes, trends, liquidity, and price action for smarter trading decisions.
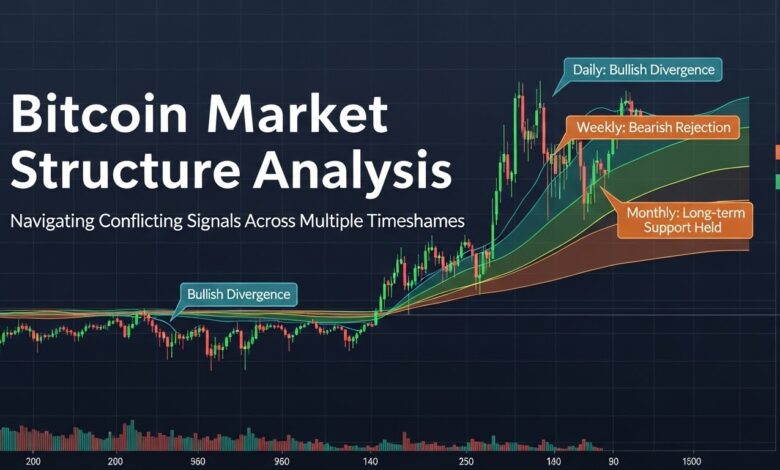
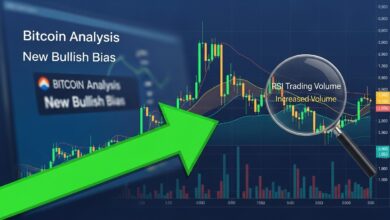
Bitcoin has matured from a speculative experiment into a globally traded macro asset, attracting institutional capital, derivatives markets, and long-term investors. With that evolution, Bitcoin market structure analysis has become increasingly important for bitcoin traders and investors attempting to interpret price behavior that often sends mixed signals. One timeframe might suggest strong bullish continuation, while another hints at exhaustion or distribution. These conflicting signals can create confusion, emotional decision-making, and poorly timed entries or exits.
Market structure analysis offers a framework for understanding how price moves, where liquidity sits, and how participants across different time horizons interact. Unlike indicators that lag price action, market structure focuses on highs, lows, trends, and breaks, helping traders align themselves with dominant forces rather than reacting to short-term noise. However, Bitcoin’s unique characteristics—24/7 trading, high volatility, and global participation—mean that structure often looks different depending on whether you observe it on a daily, four-hour, or intraday chart.
This article provides a comprehensive Bitcoin market structure analysis that explains how to navigate conflicting signals across multiple timeframes. By understanding the relationship between higher-timeframe trends and lower-timeframe price action, traders can improve consistency, reduce false signals, and develop a clearer directional bias. Whether you are a swing trader, day trader, or long-term investor, mastering multi-timeframe structure is essential in today’s complex crypto environment.
Bitcoin Market Structure
What Is Market Structure in Bitcoin Trading
Market structure refers to the sequence of price movements that define a trend or range. In Bitcoin trading, structure is built around higher highs, higher lows, lower highs, and lower lows. A bullish structure forms when price consistently makes higher highs and higher lows, while a bearish structure emerges through lower highs and lower lows. When price oscillates within defined boundaries without breaking either direction, the market is considered range-bound.
Unlike traditional assets, Bitcoin trades continuously, which can blur session-based structure and lead to frequent tests of liquidity. This makes Bitcoin market structure analysis particularly valuable, as it helps traders distinguish meaningful breaks from temporary volatility. Structure is not about predicting the future but about interpreting what the market is currently doing and who is in control.
Market structure also reflects participant behavior. Long-term investors focus on weekly and daily charts, institutions often operate around key daily levels, while short-term traders react to intraday structure. Conflicts arise when these groups act simultaneously, pushing price in different directions depending on the timeframe observed.
Why Market Structure Is Different in Crypto Markets
Bitcoin’s market structure differs from traditional markets due to its decentralized nature and global liquidity. There is no central exchange, and price discovery occurs across multiple venues. This can lead to liquidity-driven wicks, sudden breakouts, and false breakdowns that temporarily distort structure on lower timeframes.
Another defining feature is Bitcoin’s sensitivity to macro news and on-chain data. A structurally bullish daily chart can experience sharp intraday sell-offs due to funding rate shifts, ETF flows, or regulatory headlines. As a result, conflicting signals across multiple timeframes are not anomalies but a natural characteristic of the Bitcoin market.
The Role of Multiple Timeframes in Bitcoin Analysis
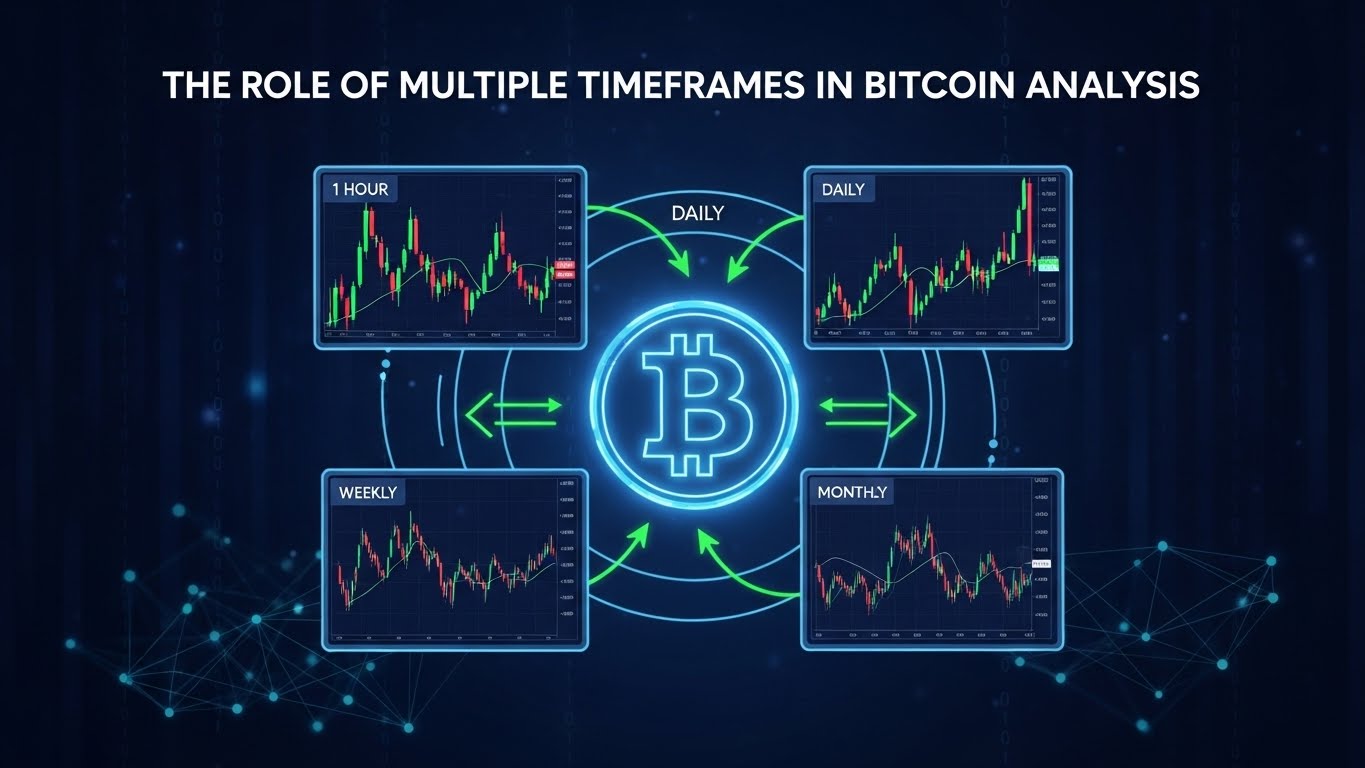
Higher Timeframes: Defining the Primary Trend
Higher timeframes such as the weekly and daily charts establish the dominant market trend. These charts filter out noise and highlight where Bitcoin stands in its broader cycle. A bullish higher-timeframe structure indicates accumulation, expansion, or continuation phases, while a bearish structure suggests distribution or corrective phases.
In Bitcoin market structure analysis, higher timeframes should always take precedence. If the daily chart shows higher highs and higher lows, then lower-timeframe pullbacks are often corrective rather than trend-reversing. Traders who ignore this context risk overreacting to short-term moves that go against the dominant trend.
Higher-timeframe levels also act as magnets for price. Daily support and resistance zones, previous highs and lows, and weekly range boundaries often dictate where liquidity pools form. Even when lower timeframes show breakdowns, price may reverse sharply upon reaching these higher-timeframe levels.
Lower Timeframes: Timing Entries and Exits
Lower timeframes such as the four-hour, one-hour, or fifteen-minute charts provide precision. They reveal micro-structure, internal breaks, and short-term shifts in momentum. While higher timeframes define bias, lower timeframes help traders execute with better risk management.
Conflicting signals often appear when lower timeframes show bearish structure within a higher-timeframe bullish trend. This does not necessarily mean the trend has reversed. Instead, it may indicate a pullback, consolidation, or liquidity grab before continuation. Skilled traders use this information to enter positions at favorable prices rather than exiting prematurely. By aligning lower-timeframe entries with higher-timeframe structure, traders can significantly improve their win rate and reward-to-risk ratios.
Conflicting Signals Explained: Bullish and Bearish at the Same Time
Bullish Higher Timeframe, Bearish Lower Timeframe
One of the most common scenarios in Bitcoin trading is a bullish daily structure combined with bearish intraday price action. This typically occurs during corrective phases. After a strong rally, Bitcoin often retraces to rebalance order flow, fill inefficiencies, and test demand zones.
In this context, a bearish lower-timeframe structure does not invalidate the bullish outlook. Instead, it offers insight into where selling pressure is temporarily dominant. Traders who understand multi-timeframe market structure wait for signs of stabilization or a lower-timeframe structure shift back to bullish before entering long positions. This approach prevents chasing tops and encourages patience, which is essential in volatile crypto markets.
Bearish Higher Timeframe, Bullish Lower Timeframe
The opposite scenario occurs during bear market rallies or relief bounces. A bearish daily or weekly structure may remain intact even as lower timeframes print higher highs and higher lows. These moves often trap late buyers who mistake short-term strength for a trend reversal.
In Bitcoin market structure analysis, such bullish lower-timeframe signals are treated as countertrend moves unless confirmed by higher-timeframe breaks. Traders focusing on structure avoid overcommitting during these rallies and instead look for opportunities to align with the broader bearish trend once lower-timeframe momentum fades. Recognizing this distinction is critical for avoiding emotional trades driven by fear of missing out.
Key Structural Elements in Bitcoin Market Structure Analysis
Break of Structure and Market Structure Shift
A break of structure occurs when price violates a key high or low that defined the previous trend. In an uptrend, breaking the most recent higher low signals potential weakness. In a downtrend, breaking the most recent lower high suggests potential strength.
A market structure shift happens when these breaks are followed by confirmation, such as continuation or acceptance above or below key levels. In Bitcoin trading, structure shifts are more reliable on higher timeframes, while lower-timeframe shifts often serve as early signals rather than confirmations, where and when structure breaks occur across timeframes helps traders distinguish between genuine reversals and temporary volatility.
Support, Resistance, and Liquidity Zones
Support and resistance are integral to Bitcoin market structure analysis, but they are best understood as liquidity zones rather than fixed lines. Bitcoin price often overshoots these levels to trigger stop orders before reversing, creating the illusion of false breakouts or breakdowns.
Higher-timeframe support and resistance zones carry more weight and frequently align with institutional interest. When conflicting signals appear, observing how price reacts around these zones provides valuable context. Strong reactions suggest continuation or reversal, while weak reactions indicate consolidation.
Market Structure and Bitcoin Cycles
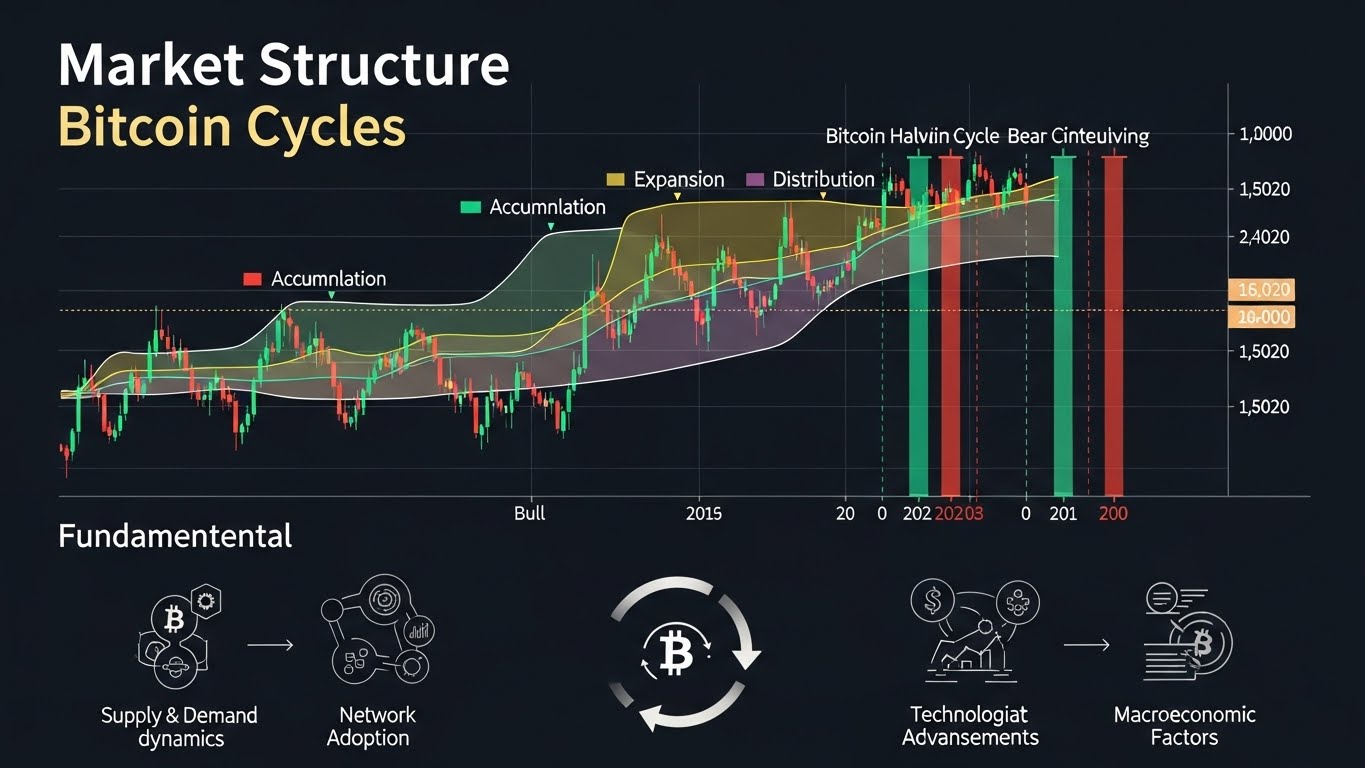
Accumulation, Expansion, Distribution, and Decline
Bitcoin market structure aligns closely with classic market cycles. During accumulation, structure is often choppy, with overlapping highs and lows. Expansion phases show clean bullish structure with impulsive moves. Distribution introduces conflicting signals, as higher timeframes flatten while lower timeframes remain volatile. Decline phases exhibit clear bearish structure. By incorporating cycle analysis into Bitcoin market structure analysis, traders gain a broader perspective that complements technical observations.
Risk Management in Conflicting Market Structures
Aligning Bias With the Dominant Timeframe
Effective risk management begins with aligning bias to the dominant timeframe. When higher timeframes are bullish, short positions should be smaller and quicker. When higher timeframes are bearish, long positions should be treated cautiously.
This approach does not eliminate losses, but it reduces exposure to high-risk scenarios where structure alignment is weak. In Bitcoin trading, where volatility is constant, this discipline is crucial.
Avoiding Overtrading During Structural Uncertainty
Conflicting signals often indicate consolidation or transition phases. These periods are notorious for whipsaws and false signals. Recognizing structural uncertainty allows traders to reduce position size, widen stops, or stay sidelined. Patience is an underappreciated skill in Bitcoin market structure analysis, yet it often separates consistent traders from inconsistent ones.
Integrating Market Structure With Other Analytical Tools
Volume, Momentum, and On-Chain Context
While market structure is powerful on its own, it becomes even more effective when combined with volume analysis, momentum indicators, and on-chain data. Rising volume during a structure break adds credibility, while declining volume suggests a lack of conviction.
On-chain metrics can provide higher-timeframe context, helping traders interpret whether structural shifts reflect genuine accumulation or speculative noise. This integrated approach strengthens decision-making without relying on over-optimization.
Conclusion: Mastering Bitcoin Market Structure Across Timeframes
Navigating conflicting signals is one of the biggest challenges in Bitcoin trading, but it is also one of the greatest opportunities for disciplined traders. Bitcoin market structure analysis provides a clear framework for understanding how price behaves across multiple timeframes and why those behaviors often appear contradictory.
By prioritizing higher-timeframe trends, using lower timeframes for execution, and recognizing the role of liquidity and market cycles, traders can transform confusion into clarity. Conflicting signals are not errors in analysis; they are reflections of a diverse market operating simultaneously on different horizons.
Ultimately, success in Bitcoin trading comes from alignment—aligning bias with structure, execution with context, and risk with uncertainty. Those who master this alignment are better equipped to navigate volatility and adapt to Bitcoin’s ever-evolving market landscape.
FAQs
Q: What is Bitcoin market structure analysis?
Bitcoin market structure analysis is the study of price trends, highs, lows, and breaks across different timeframes to understand market direction and participant behavior.
Q: Why do Bitcoin charts show conflicting signals across timeframes?
Conflicting signals occur because different market participants operate on different time horizons, causing short-term moves that may oppose the dominant long-term trend.
Q: Which timeframe is most important for Bitcoin market structure?
Higher timeframes such as the daily and weekly charts are most important because they define the primary trend and major support and resistance zones.
Q: How can traders use lower timeframes effectively?
Lower timeframes are best used for timing entries and exits in alignment with higher-timeframe structure rather than for defining overall market direction.
Q: Can market structure analysis work without indicators?
Yes, market structure analysis can be highly effective on its own, though combining it with volume, momentum, or on-chain data can provide additional confirmation.