Bitcoin Price Prediction: Critical $67K Warning Looms as Weekly Dead Cross Pattern Threatens BTC
Bitcoin price prediction turns cautious as BTC faces a critical $67K level and a looming weekly dead cross that could reshape the crypto market outlook.
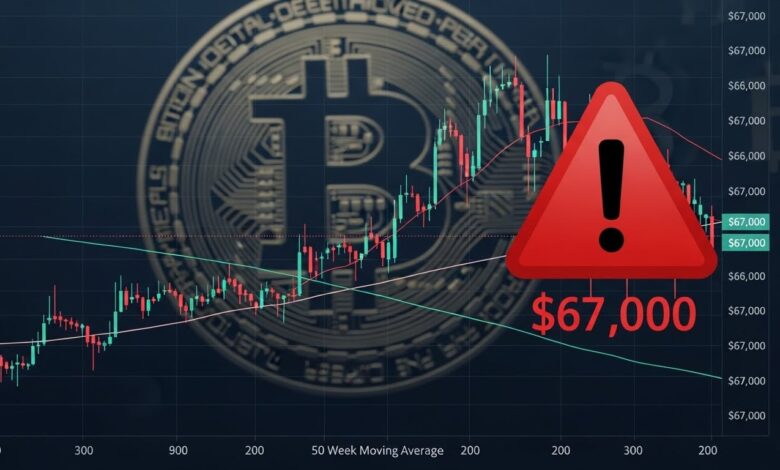
The Bitcoin price prediction narrative has entered a highly sensitive phase as BTC hovers near a critical support zone around $67,000. After months of volatility, strong rallies, and repeated rejections near key resistance levels, the market is now fixated on a potentially bearish technical signal: the weekly dead cross pattern. This formation, where the 50-week moving average crosses below the 200-week moving average, has historically preceded extended periods of consolidation or deeper corrections for Bitcoin.
While Bitcoin remains structurally strong on a long-term basis, short- to medium-term signals suggest growing downside risk. Traders, long-term investors, and institutions are all watching closely as BTC’s price action tightens, volatility compresses, and macro uncertainty continues to influence crypto markets. The $67K level is not just another psychological price point; it represents a confluence of technical, on-chain, and sentiment-based indicators that could determine Bitcoin’s next major move.
This article provides an in-depth Bitcoin price prediction, analyzing the implications of the looming weekly dead cross, the importance of the $67K support zone, broader market structure, macroeconomic influences, and possible bullish and bearish scenarios ahead. By examining technical indicators, market sentiment, on-chain data, and historical price behavior, we aim to offer a balanced and actionable outlook for BTC investors navigating this crucial moment.
The Weekly Dead Cross and Why It Matters
What Is a Weekly Dead Cross in Bitcoin?
A weekly dead cross occurs when a shorter-term moving average, typically the 50-week moving average, crosses below a longer-term average such as the 200-week moving average. In traditional financial markets, this pattern is widely regarded as a bearish signal, often indicating a shift from bullish momentum to a prolonged corrective or sideways phase.
In the context of Bitcoin price prediction, the weekly dead cross carries significant weight because it reflects sustained weakness over several months rather than short-term volatility. Unlike daily or hourly signals, weekly indicators smooth out noise and capture broader market trends. When Bitcoin approaches a weekly dead cross, it suggests that recent selling pressure has been strong enough to alter the long-term momentum curve.
Historically, Bitcoin has not always reacted immediately to a weekly dead cross. In some cases, price action has already declined substantially before the signal appears. However, the pattern has often coincided with periods of reduced upside potential and heightened downside risk, making it a crucial warning sign for market participants.
Historical Impact of Dead Cross Patterns on BTC
Looking back at previous Bitcoin cycles, weekly dead cross formations have frequently emerged during transitional phases of the market. In past bear markets, such signals aligned with extended consolidation zones where BTC traded sideways for months before establishing a new accumulation base.
For example, during earlier market downturns, Bitcoin often experienced sharp corrections, followed by a weekly dead cross that confirmed bearish momentum. While these phases were painful in the short term, they ultimately laid the groundwork for future bull markets. This historical context is essential when forming a Bitcoin price prediction, as it highlights that bearish signals do not necessarily imply long-term failure but rather a potential reset in market structure.
That said, the current market environment is unique. Institutional involvement, spot Bitcoin ETFs, and global macroeconomic factors add layers of complexity that did not exist in earlier cycles. As a result, the implications of a weekly dead cross today may differ in magnitude and duration compared to the past.
The Critical Importance of the $67K Bitcoin Support Level

Why $67K Is a Key Psychological and Technical Zone
The $67,000 level has emerged as a crucial battleground in the current Bitcoin price prediction framework. Psychologically, round numbers often act as magnets for market activity, attracting both buyers and sellers. Technically, $67K aligns with previous consolidation ranges, volume profile support, and key Fibonacci retracement levels from recent highs.
This price zone has repeatedly served as a pivot point where Bitcoin either bounced decisively or faced strong rejection. As BTC trades near this level again, market participants are keenly aware that a sustained breakdown could trigger cascading stop-loss orders and accelerate downside momentum.
From a structural perspective, holding above $67K would suggest that buyers are still willing to defend higher lows, preserving a bullish macro trend. Conversely, losing this support on a weekly closing basis could confirm bearish dominance and increase the probability of deeper corrections toward lower support zones.
What Happens If Bitcoin Loses $67K?
If Bitcoin decisively breaks below $67K, the Bitcoin price prediction outlook turns notably more cautious. A breakdown could open the door to retests of lower support areas, potentially in the $62K to $60K range, where historical demand and on-chain cost basis metrics converge.
Such a move would likely coincide with heightened market fear, declining funding rates, and increased selling pressure from leveraged traders. Long-term holders might remain resilient, but short-term sentiment could deteriorate rapidly, amplifying volatility.
However, it is important to note that breakdowns do not always lead to sustained bear markets. In some scenarios, Bitcoin briefly dips below key support levels only to reclaim them quickly, creating so-called “bear traps.” The behavior of volume, momentum indicators, and derivatives markets will be crucial in determining whether a loss of $67K represents a temporary deviation or a more meaningful trend reversal.
Technical Indicators Shaping the Current Bitcoin Price Prediction
Moving Averages and Trend Structure
Moving averages remain central to any Bitcoin price prediction, especially on higher timeframes. The narrowing gap between the 50-week and 200-week moving averages highlights weakening bullish momentum. While BTC is still trading above certain long-term averages, the slope of these indicators has flattened, signaling indecision.
On the daily timeframe, shorter-term moving averages have struggled to reclaim dominance, reinforcing the idea that upside attempts are being sold into. Until Bitcoin can establish sustained closes above key moving averages, rallies may continue to face resistance.
Despite this, long-term trend structure remains intact as long as Bitcoin avoids a prolonged stay below major weekly support zones. This underscores the importance of viewing technical signals in context rather than isolation.
RSI, MACD, and Momentum Signals
Momentum indicators offer mixed signals for Bitcoin. The Relative Strength Index (RSI) on the weekly chart has drifted lower but remains above extreme oversold territory. This suggests that while bearish pressure is building, there may still be room for further downside before a strong relief rally emerges.
The MACD indicator on higher timeframes has shown signs of bearish crossover, reinforcing concerns about slowing momentum. However, momentum indicators often lag price action, meaning that sudden shifts in sentiment or macro catalysts can quickly invalidate bearish setups. For traders and investors forming a Bitcoin price prediction, these indicators highlight caution rather than outright panic. They suggest a market in transition rather than one in freefall.
On-Chain Data and Investor Behavior
Long-Term Holders vs Short-Term Speculators
On-chain metrics provide valuable insight into the underlying health of the Bitcoin network. Data suggests that long-term holders continue to exhibit relatively strong conviction, with limited distribution at current price levels. This behavior historically acts as a stabilizing force during periods of market uncertainty.
In contrast, short-term holders appear more sensitive to price fluctuations, contributing to increased volatility around key levels like $67K. When short-term participants dominate market activity, price swings tend to become sharper and less predictable.
This divergence between holder cohorts is a critical component of the broader Bitcoin price prediction, as it indicates that while speculative pressure may drive short-term moves, the long-term investment thesis remains largely intact.
Exchange Flows and Supply Dynamics
Exchange inflow and outflow data suggest a relatively balanced supply environment. While there have been periodic spikes in inflows during price drops, there is no clear evidence of mass capitulation. This implies that selling pressure, while present, is not yet at panic levels.
Additionally, Bitcoin’s fixed supply and ongoing adoption continue to underpin long-term value propositions. Even amid bearish technical signals like the weekly dead cross, these structural factors cannot be ignored when assessing future price trajectories.
Macro Environment and Its Influence on Bitcoin

Interest Rates, Inflation, and Risk Assets
The macroeconomic backdrop plays a crucial role in shaping any Bitcoin price prediction. High interest rates and persistent inflation concerns have made global markets more sensitive to risk. As a result, Bitcoin has increasingly traded in correlation with broader risk assets such as equities and technology stocks. When investors become risk-averse, speculative assets like BTC often face selling pressure. Conversely, signs of monetary easing or declining inflation can reignite appetite for alternative stores of value, including Bitcoin.
The current environment remains uncertain, with markets oscillating between optimism and caution. This ambiguity adds another layer of complexity to Bitcoin’s price outlook, especially as technical warning signs emerge.
Institutional Sentiment and ETF Flows
Institutional involvement has transformed Bitcoin’s market dynamics. Spot Bitcoin ETFs and increased participation from asset managers have introduced new sources of demand, but also new forms of volatility tied to traditional market sentiment.
ETF inflows and outflows can amplify price movements, particularly around key technical levels. If institutional investors interpret the weekly dead cross and $67K warning as reasons to reduce exposure, short-term downside risk could increase. Conversely, sustained inflows could help absorb selling pressure and stabilize prices.
Bullish and Bearish Scenarios Ahead for Bitcoin
Bearish Scenario: Dead Cross Confirmation and Deeper Correction
In a bearish scenario, Bitcoin confirms the weekly dead cross and fails to hold above $67K. This could trigger a corrective phase characterized by lower highs, declining momentum, and increased volatility. Price targets in this scenario may extend toward lower support zones, where stronger buying interest could eventually emerge.
Such a correction would not necessarily invalidate Bitcoin’s long-term bullish narrative, but it would require patience from investors and traders alike. Historically, these phases often test conviction and reset market expectations.
Bullish Scenario: Support Holds and Trend Resilience Prevails
In a more optimistic scenario, Bitcoin defends the $67K level and invalidates the bearish implications of the weekly dead cross through renewed buying pressure. Strong closes above key resistance levels could restore confidence and shift the Bitcoin price prediction back toward higher targets.
This outcome would likely require supportive macro conditions, renewed institutional inflows, or a catalyst that reinforces Bitcoin’s value proposition. If achieved, it could mark the resumption of a broader bullish trend rather than a prolonged correction.
Conclusion: Navigating Bitcoin’s $67K Warning Zone
The current Bitcoin price prediction landscape is defined by uncertainty, caution, and critical technical signals. The looming weekly dead cross and the importance of the $67K support level underscore that BTC is at a pivotal moment. While bearish risks are clearly present, long-term fundamentals and on-chain data suggest resilience beneath the surface.
For investors, this phase calls for careful risk management, patience, and a balanced perspective. Bitcoin has weathered similar moments in the past, often emerging stronger after periods of consolidation and correction. Whether BTC breaks lower or finds renewed strength above $67K, the coming weeks are likely to shape the next major chapter in Bitcoin’s evolving market cycle.
FAQs
Q: What does the weekly dead cross mean for Bitcoin price prediction?
The weekly dead cross is a bearish technical signal indicating weakening long-term momentum. It often precedes consolidation or corrections but does not guarantee a prolonged bear market.
Q: Why is $67K such an important level for Bitcoin?
The $67K level is a key psychological and technical support zone. Holding above it suggests trend resilience, while a breakdown could trigger further downside.
Q: Has Bitcoin recovered after dead crosses in the past?
Yes, historically Bitcoin has often recovered after dead cross phases, using them as periods of accumulation before future bull runs.
Q: Should long-term investors be worried about current signals?
Long-term investors should be cautious but not overly alarmed. Structural fundamentals and long-term adoption trends remain supportive despite short-term risks.
Q: What could invalidate the bearish Bitcoin price prediction?
A strong defense of $67K, renewed institutional inflows, bullish macro developments, or a sustained move above key resistance levels could invalidate bearish scenarios.