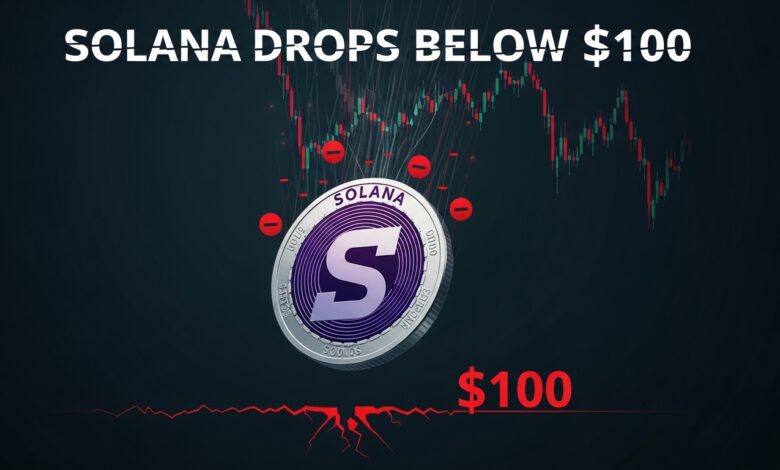
Solana Drops Below $100 Bearish Trend and Price Forecast the move has sparked renewed concern among traders and investors who have been closely watching the SOL price trend and overall cryptocurrency market sentiment. While Solana has previously demonstrated resilience during volatile cycles, the current downward movement reflects broader bearish market conditions and weakening momentum across several major altcoins.
The drop below $100 is not just a numerical milestone. In technical terms, such psychological price zones often act as key support or resistance levels. When an asset like Solana falls below a widely watched threshold, it can trigger additional selling pressure, especially from short-term traders and automated strategies. The result is often an acceleration in the downtrend structure until a strong support base is found.
At the same time, long-term investors continue to evaluate Solana’s underlying fundamentals. The network remains one of the most active layer-1 blockchain ecosystems, with continued development in decentralized finance, non-fungible tokens, and Web3 applications. This contrast between strong fundamentals and weak short-term price action creates a complex environment where both bearish and bullish arguments exist.
Understanding where Solana could head next requires a closer look at technical indicators, market sentiment, macroeconomic factors, and on-chain activity. The following analysis explores why Solana has dropped below $100, what signals are shaping the current trend, and what the Solana price forecast suggests for the coming weeks and months.
Solana Drops Below $100 Bearish Trend
The decline below $100 is the result of several overlapping factors rather than a single event. The cryptocurrency market tends to move in cycles, and Solana’s recent drop reflects both internal and external pressures.
Broader Crypto Market Weakness
One of the main drivers behind the decline is the overall crypto market correction. When major assets like Bitcoin and Ethereum experience downward momentum, altcoins typically follow. Solana, being a high-beta asset, often moves more aggressively in both upward and downward directions.
During bearish cycles, capital tends to rotate away from riskier altcoins into more established assets or stablecoins. This shift reduces buying pressure on tokens like SOL and contributes to the continuation of the bearish price trend.
Profit-Taking After Previous Rallies
Solana previously experienced strong upward movements during bullish phases, attracting both retail and institutional interest. After significant gains, many traders choose to lock in profits, especially when technical indicators suggest overbought conditions. This profit-taking phase often leads to a period of consolidation or decline. When enough sellers enter the market simultaneously, the price can fall through key support levels, such as the $100 mark.
Weak Technical Structure
From a technical perspective, Solana’s price chart has shown signs of weakening momentum. Lower highs and lower lows indicate a classic downtrend formation, suggesting that sellers are in control.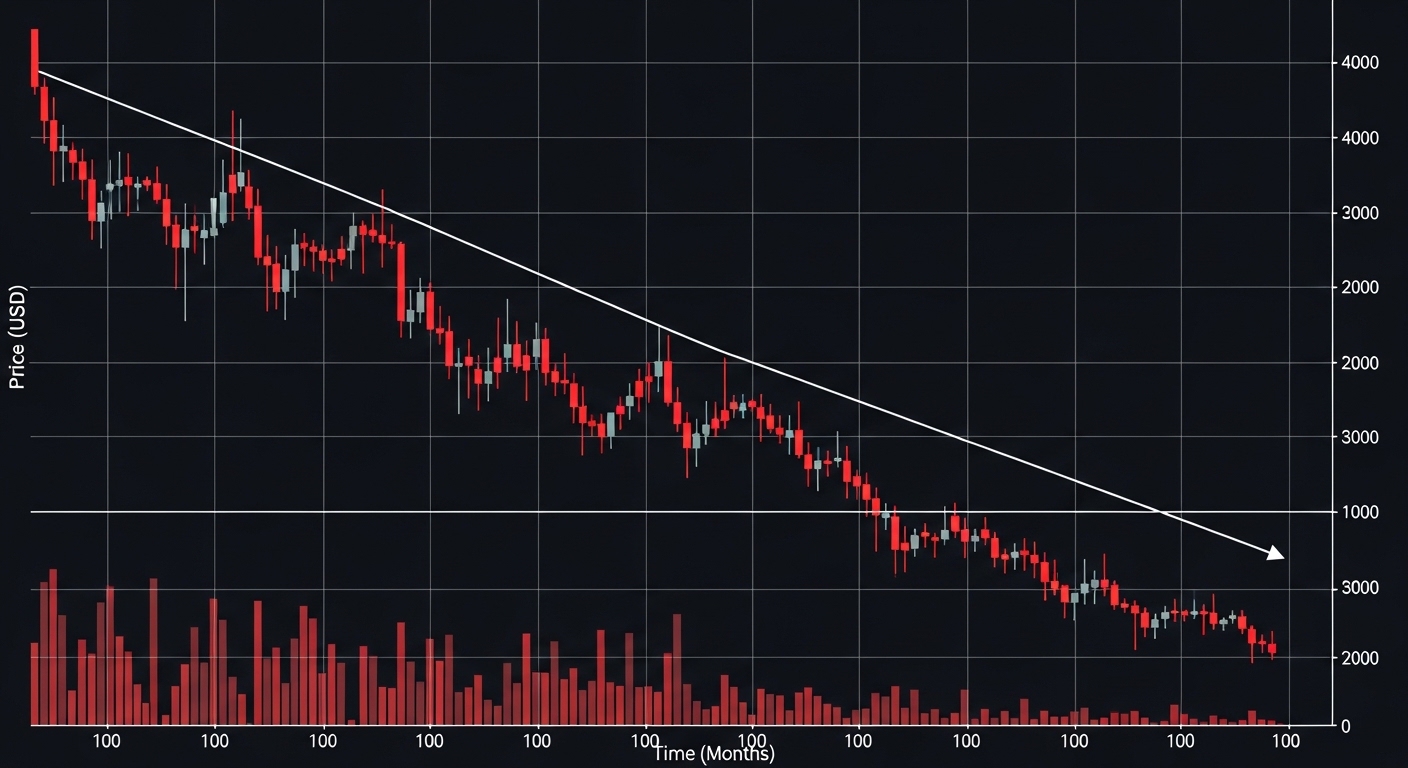
Breaking below a psychological support level reinforces bearish sentiment, as it confirms the continuation of the existing trend rather than a reversal.
Technical Analysis of Solana’s Price Action
Technical indicators provide deeper insight into Solana’s current market structure. Several signals suggest that the bearish trend remains intact, although potential reversal zones may be forming.
Key Support and Resistance Levels
With the price now below $100, traders are watching nearby support zones where buying interest may re-emerge. Historically, previous consolidation areas often act as support during downtrends.
If the price stabilizes around these levels, it could signal the beginning of a price consolidation phase. However, if selling pressure continues, the next support areas could come into focus. On the upside, the $100 level has now turned into a resistance zone. For a bullish reversal to occur, Solana would need to reclaim this level and maintain strong trading volume above it.
Relative Strength Index Signals
The Relative Strength Index (RSI) is one of the most commonly used momentum indicators. When RSI drops toward or below the oversold region, it can indicate that selling pressure may be nearing exhaustion.
However, during strong bearish trends, RSI can remain in oversold territory for extended periods. This means that while the indicator may hint at a potential bounce, it does not guarantee an immediate reversal.
Moving Average Trends
Moving averages are essential tools for identifying long-term trends. Solana’s price trading below key moving averages suggests continued bearish momentum.
When shorter-term moving averages cross below longer-term ones, it forms what traders call a bearish crossover, often interpreted as a signal that the downtrend could persist.
Market Sentiment and Investor Behavior
Market sentiment plays a major role in determining price direction. Even strong projects can experience prolonged declines if sentiment turns negative.
Fear-Driven Selling
When prices drop below psychological levels like $100, fear often spreads among investors. This emotional reaction can lead to panic selling, further accelerating the decline. Short-term traders, in particular, tend to exit positions quickly during such moments, increasing volatility.
Institutional Positioning
Institutional investors often take a more strategic approach. Instead of reacting to short-term price movements, they focus on long-term fundamentals. If institutions view Solana as undervalued at lower prices, they may begin accumulating, which could eventually stabilize the market.
On-Chain Activity and Network Fundamentals
Despite the price decline, Solana’s blockchain activity remains a critical factor in evaluating its long-term outlook.
Growing Ecosystem Development
Solana continues to host a wide range of decentralized applications, including DeFi protocols, NFT platforms, and gaming projects. Developer activity remains strong, which is a positive sign for the network’s future. Consistent ecosystem growth often supports long-term price appreciation, even if short-term volatility persists.
Transaction Speed and Cost Advantages
One of Solana’s key strengths is its high transaction throughput and low fees. These features make it attractive for developers and users seeking efficient blockchain solutions. As adoption increases, demand for SOL tokens could rise, potentially supporting price recovery over time.
Macro Factors Affecting Solana’s Price
Cryptocurrency prices are heavily influenced by macroeconomic conditions.
Interest Rate Environment
Higher interest rates tend to reduce risk appetite among investors. When traditional markets offer safer returns, speculative assets like cryptocurrencies often see reduced demand. If global monetary conditions remain tight, Solana and other altcoins may face continued pressure.
Regulatory Developments
Regulatory news can significantly impact the cryptocurrency market. Positive regulatory clarity often boosts investor confidence, while restrictive policies can trigger sell-offs. Solana’s price trajectory may partly depend on how global regulators approach digital assets in the coming months.
Short-Term Solana Price Forecast
In the short term, Solana’s price direction will likely depend on whether it can establish a stable support zone below $100. If buyers step in and the price begins forming higher lows, a short-term relief rally could occur. This would likely target the $100 resistance area first.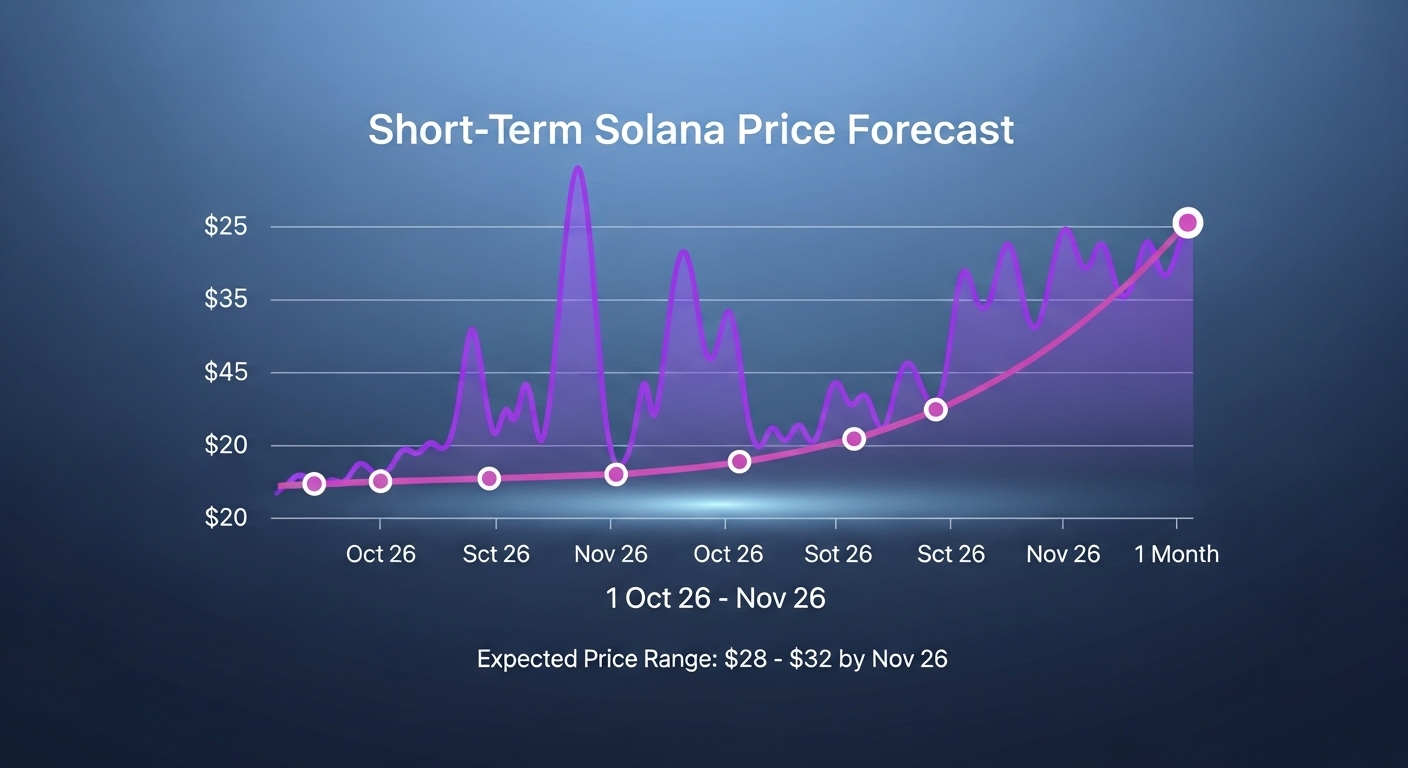
However, if selling pressure continues and support levels fail, Solana could move toward lower price zones before finding a strong base. Market volatility is expected to remain high in the near term, especially if the broader crypto market experiences further corrections.
Long-Term Solana Price Outlook
While short-term price action appears bearish, the long-term outlook depends heavily on adoption, development, and overall market cycles.
Bullish Long-Term Scenario
In a bullish scenario, Solana continues to attract developers and users, expanding its ecosystem. Increased adoption could drive higher demand for SOL tokens, supporting price growth. If the broader crypto market enters another bull cycle, Solana could regain momentum and potentially revisit previous highs.
Bearish Long-Term Scenario
In a bearish scenario, prolonged market weakness and reduced investor interest could keep prices suppressed. If network activity declines or competitors gain market share, Solana’s growth could slow. However, as long as development continues, the long-term outlook may remain cautiously optimistic.
Key Indicators to Watch
Several indicators will help determine Solana’s future price direction. Traders are closely monitoring trading volume, as increased volume often signals stronger market conviction. Rising volume during price increases could indicate the start of a recovery.
Another important factor is the overall crypto market trend. If Bitcoin and Ethereum begin to recover, altcoins like Solana may follow. Finally, on-chain metrics such as active addresses, transaction counts, and developer activity can provide insight into the network’s health.
Conclusion
Solana’s drop below $100 marks a significant moment in its recent price history. The move reflects a combination of bearish technical signals, broader crypto market weakness, and shifting investor sentiment. While the short-term outlook remains uncertain, the network’s strong fundamentals and active ecosystem continue to support its long-term potential. The coming weeks will be crucial for determining whether Solana can stabilize and reclaim the $100 level or continue its downward trajectory. Traders and investors will need to monitor technical indicators, market sentiment, and macroeconomic developments closely.
Despite the current bearish trend, Solana remains one of the most prominent layer-1 blockchain platforms. Its future price performance will ultimately depend on adoption, innovation, and the overall direction of the cryptocurrency market.
FAQs
Q: Why did Solana drop below $100?
Solana dropped below $100 mainly due to broader cryptocurrency market weakness, profit-taking after previous rallies, and bearish technical indicators. When the overall market sentiment turns negative, high-volatility altcoins like Solana tend to experience sharper declines.
Q: Is Solana still a good long-term investment?
Solana’s long-term potential depends on its ecosystem growth, developer activity, and adoption rates. The network continues to host a wide range of decentralized applications and maintains strong technical advantages, which could support future price growth if market conditions improve.
Q: What are the key support levels for Solana now?
With the price below $100, traders are watching nearby historical consolidation zones for support. These levels often act as buying areas where the price may stabilize before making its next move.
Q: Can Solana recover above $100 soon?
A recovery above $100 is possible if buying pressure increases and the broader crypto market stabilizes. For a sustained rally, Solana would need to reclaim $100 as support and maintain strong trading volume above that level.
Q: What indicators should traders watch for a Solana reversal?
Traders often monitor indicators such as RSI, moving averages, trading volume, and on-chain activity. Improvements in these metrics can signal weakening bearish momentum and the potential start of a recovery trend.